12 3D Printing Science Fair Projects for Middle School: Testable Experiment Ideas
A 3D printer can make toys, models, spare parts, and phone stands. None of that is a science fair project. A finished object proves the machine works. Nothing more. It does not prove anything about the world.
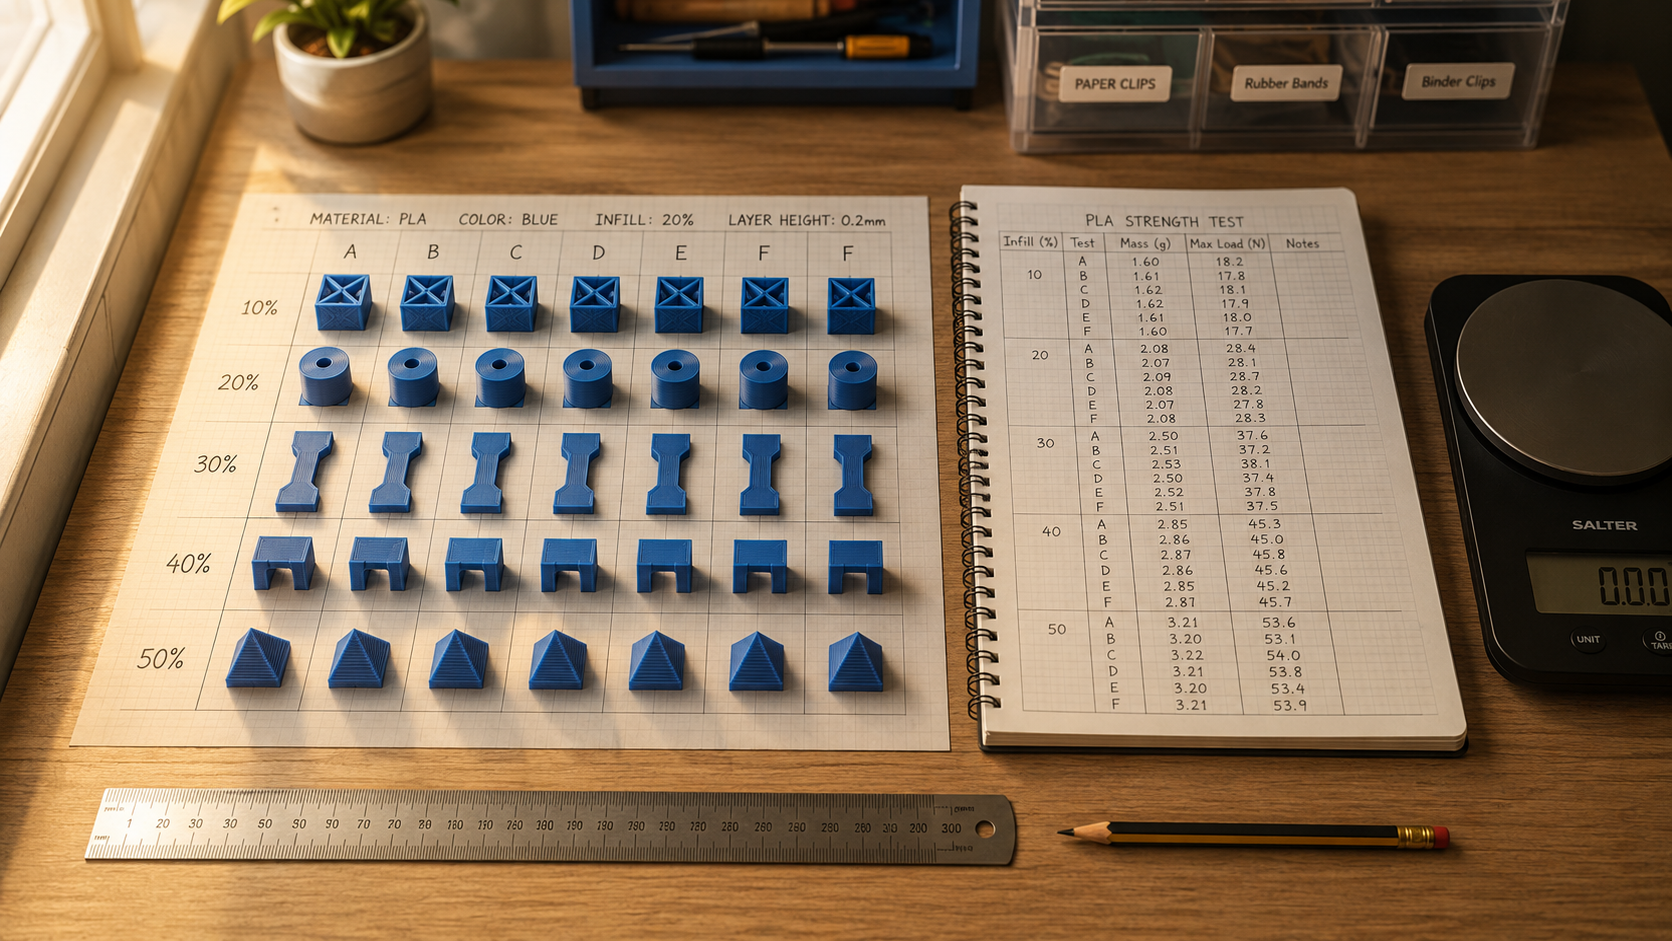
Judges look for one thing first. Did the student ask a question, change one factor, and measure what happened? That is the game. Everything else is decoration. The printer is just the tool that lets you build four bridges instead of one, or eight test bars that differ by a single slicer setting.
The twelve projects below are built that way. Each one names the factor you change, the result you measure, and the conditions you hold steady. They cover structures, motion, sound, light, friction, erosion, and plant watering. Print times stay short. Most fit inside a school deadline.
These 3D printing science fair projects for middle school are designed as easy, testable experiments with clear variables, measurable results, and realistic print times.
|
Project |
You Change |
You Measure |
Prints |
Effort |
|
1. Bridge design vs load |
Beam, arch, or truss shape |
Weight held before failure |
9 |
Medium |
|
2. Infill density vs strength |
Infill at 10, 30, 50, 70% |
Bending load at break |
12 |
Low |
|
3. Layer orientation vs breaking force |
Flat, on edge, upright |
Force at failure |
9 |
Medium |
|
4. Wall thickness vs impact |
1, 2, 3, 4 wall lines |
Drop height that cracks it |
12 |
Medium |
|
5. Propeller pitch vs airflow |
Blade angle 10 to 40 degrees |
Air speed in m/s |
4 to 8 |
High |
|
6. Top mass placement vs spin |
Mass at centre, rim, or even |
Seconds until it falls |
9 |
Medium |
|
7. Gear ratio vs lifting |
Ratios 1:1, 2:1, 3:1 |
Lift time and max load |
6 to 12 |
High |
|
8. Tube length vs pitch |
Tubes 50 to 125 mm |
Loudest frequency in Hz |
4 to 8 |
Low |
|
9. Pinhole size vs sharpness |
Aperture diameter |
Line separation in the image |
4 plates |
Medium |
|
10. Surface texture vs friction |
Smooth, lined, dotted, crosshatch |
Angle where sliding starts |
4 to 8 |
Low |
|
11. Slope vs soil erosion |
Tray slope 5 to 35 degrees |
Mass of soil washed out |
4 to 8 |
High |
|
12. Wick size vs soil moisture |
Wick opening diameter |
Moisture reading over days |
3 to 6 |
Medium |
What Makes a 3D Printing Project Science-Fair Ready

The difference between a model and an experiment
A printed heart, dinosaur skull, or planet is a model. It shows shape. It answers no question.
An experiment compares conditions. That is the difference. Print one bridge and you have shown the printer can make a bridge. Print three bridge shapes, load each one until it fails, and you now have numbers that can go on a graph. The comparison is the science. The plastic is just how you got there.
Strong projects also explain why the result matters. A bridge test shows how shape carries load. An infill test shows how much plastic you can remove before a part gets too weak to use.
How to choose a testable research question
Good questions follow one pattern. How does changing X affect Y?
X is what you control. Y is what you record. Nothing vague. Both need to be specific enough that another student could repeat the test and get close to your numbers.
- How does infill density affect the weight a printed beam can hold?
- How does blade pitch affect airflow speed at a fixed motor speed?
- How does tube length affect the loudest frequency a resonator produces?
- How does slope angle affect the mass of soil washed away by simulated rain?
Skip anything that depends on taste. "Which bridge looks best?" cannot be scored fairly. "Which bridge holds the most weight?" gives you a number in pounds.
Independent, dependent, and controlled variables
The independent variable is the one thing you change on purpose. Just one. In an infill study that is the infill percentage.
The dependent variable is the measurement you take. Maximum load before the beam bends or snaps.
Controlled variables are everything you keep the same. Filament brand and spool, nozzle diameter, layer height, wall count, nozzle and bed temperature, part dimensions, support distance, and where you place the weight. Write them down before you print. A control you forgot to record is a control you cannot defend. Judges ask.
|
VARIABLE PLAN TEMPLATE Independent variable: bridge design (beam, arch, truss) Dependent variable: maximum load before failure, in pounds Controlled: span length, width, filament spool, layer height, wall count, nozzle temperature, load position, loading increment |
Writing a hypothesis judges take seriously
A hypothesis is a prediction with a reason attached. Write it first. Before you test anything.
The format that works: if the independent variable changes this way, then the dependent variable will change this way, because. Example. If infill density increases, then the beam will hold more weight, because the extra internal material resists bending.
Being wrong is fine. Truly fine. Judges score the method and the explanation, not the accuracy of your guess. An unexpected result usually makes for a better conversation than a confirmed one. Avoid vague wording like "Design A will be better." Better at what? Measured how?
Planning trials, measurements, and data tables
One trial is one complete test of one sample. Three trials per condition is the working minimum for middle school. Fewer will not hold. Four infill settings at three trials each means twelve printed pieces.
Build the data table before you slice anything. Columns for sample code, independent variable value, measurement, observations, and pass or fail. Drawing the empty table often reveals a step you forgot to plan. Do it early.
Use clear units every time. No exceptions. Grams or pounds for mass, seconds for time, millimetres for length, hertz for frequency, degrees for angle. Observations matter too. A bridge that cracks at the centre and a bridge that splits at a joint failed for different reasons.
Printer Safety, Materials, and Project Planning
Safety rules before the first print
A printer has hot surfaces and moving parts. The nozzle, heater block, and heated bed can burn skin during a print and for several minutes afterward. Keep hair, sleeves, cords, and jewellery clear of belts, fans, and the print head. Tie it all back.
Ventilation deserves more attention than it usually gets. EPA research on 3D printer emissions reports that filament printing releases volatile organic compounds along with ultrafine particles in the 1 to 100 nanometre range, small enough to travel deep into the respiratory tract. EPA modelling of children from three months to eighteen years old predicted the highest mass deposition in the nine to eighteen age group, and mostly in the lungs. That is exactly the middle school range.
Controls are simple. Print in a ventilated room, use an enclosed machine, and cut the time spent standing next to it while it runs. Simple enough. NIOSH's health and safety checklist for filament printing walks through the same hierarchy: characterise the hazard, change the work activity, add engineering controls, then set workplace rules, and only reach for protective equipment last. It also flags thermal gloves for handling hot print heads.
|
ADULT SUPERVISION, DRAWN AS A LINE Adult handles: loading and unloading filament, clearing jams, opening covers, breakage and drop tests, weights above a few pounds, and anything with a spinning motor. Student handles: designing the model, recording slicer settings, labelling samples, measuring, photographing, graphing, and writing the analysis. Stop the machine and get help for smoke, a strong unusual smell, damaged wiring, or movement that will not stop. |
Choosing between PLA, PETG, and TPU
One material for every sample. That is the rule. The exception is testing filament type itself.
|
Filament |
Best For |
Watch Out For |
Use It In |
|
PLA |
Bridges, beams, gears, ramps, tubes, terrain trays |
Snaps rather than bends, so failures are sudden and clean |
Projects 1, 2, 3, 8, 9, 10, 11 |
|
PETG |
Impact tests and parts that need to flex before failing |
Stringing between features, slower to dial in |
Projects 4 and 7 |
|
TPU |
Grips, soft inserts, anything meant to bend |
Feeds poorly on some extruders, prints slowly |
Optional extension to project 4 |
Colour matters more than students expect. Different pigments from the same brand can carry different additives, which changes how the plastic flows and cools. Use one spool for the whole experiment where you can. Log it either way.
Estimating print time and filament use
Slice one sample first. Always one. The slicer gives you a time and a filament length. Multiply both by the number of samples you need, then add roughly a third on top for setup, cooling, maintenance, and reprints.
Small numbers add up fast. A 45 minute sample looks harmless until you need twenty copies. That is fifteen hours. Before the first failure.
Shrink the sample, not the sample count. A test beam does not need to be full size. It needs to be identical across every condition and safe to load. Record the slicer estimate and the real elapsed time. The gap between them belongs in your project journal. It shows care.
Downloaded models versus your own CAD designs
Downloaded files are fine for a lot of projects. If your experiment is about a slicer setting, using the same downloaded beam for all twelve samples is actually better than modelling your own, because the geometry is guaranteed identical.
Check the licence. Credit the designer. Say whether you modified the file.
Original CAD gives you control that downloads cannot. Comparing bridge shapes means matching span, width, and material mass across three designs, which is far easier when you built all three. On the legal side, the U.S. Copyright Office explains that copyright covers original creative expression but not facts, ideas, systems, or methods of operation, and that protection starts the moment a work is fixed in tangible form. Trademarks are a separate matter, since they identify the source of goods rather than protect a shape. Downloading a file is not permission to reproduce or sell it. Two different things.
List the file name, the creator, where you got it, what you changed, and the final dimensions. Put that in the project notes, not on the board.
Keeping printer settings consistent during testing

Any setting you are not testing has to stay frozen. Nozzle diameter, layer height, wall count, top and bottom layers, infill pattern, nozzle and bed temperature, print speed, fan setting, and part orientation. Save the profile. Then leave it.
This is where the machine itself starts to matter. Enclosed printers with saved app profiles and auto-levelling remove the two biggest sources of drift between samples, which are bed height and ambient airflow. A printer that saves one profile for every test sample makes a twelve-piece batch far less likely to fail halfway through. The X-MAKER runs a 16-point auto-levelling routine before each print and holds a 150 by 150 by 150 mm build area, which is enough to batch several small test pieces per job. Under 50 dB also means a long overnight run will not wake the house.
Check each sample for defects before you test it. Missing layers or poor bed adhesion means it goes in the log as a failed print, not quietly into the bin. Label every piece the moment it comes off the plate. Every piece. Codes like T10-1, T10-2, T10-3 take five seconds and save an hour of confusion later.
Engineering and Material Strength Projects
1. Bridge design versus load capacity

Question: how does 3D printed bridge design affect maximum load capacity?
Print a beam bridge, an arch bridge, and a truss bridge that span the same distance. Keep length, width, filament, layer height, and wall thickness identical. Match material mass across the three as closely as you can. A bridge twice as heavy has an unfair advantage. That skews everything.
Rest each bridge on two supports set a fixed distance apart. Add weight at the centre in equal steps. Record two numbers: the load where permanent bending appears, and the load where it breaks. Three copies of each design gives you nine prints and three averages. Manageable in a week.
Photograph the break every time. Trusses tend to fail at a joint. Beams tend to crack across the middle. Those patterns are how you explain where the force travelled. Dividing load capacity by bridge mass gives you a strength-to-weight figure, which is the comparison real engineers actually care about. Include it.
2. Infill density versus part strength
Question: how does infill density affect the bending strength of a printed beam?
Test 10, 30, 50, and 70 percent. Same beam model. Same infill pattern. Same orientation. Same everything else. Load the centre until the beam bends past a set amount or breaks.
Record three things per sample, not one: maximum load, sample mass, and print time. That turns a simple strength test into a trade-off study. Higher infill usually holds more, but the gain per added percentage tends to shrink. A graph of infill against load shows the strength curve. A second graph of infill against print time or load per gram shows the cost of that strength. Judges notice that graph.
3. Layer orientation versus breaking force
Question: how does print orientation affect the breaking force of a printed test bar?
Print the same bar three ways. Flat on the bed, standing on its edge, and upright. Nothing else changes.
Bend or pull each bar in the same direction using the same jig. Add load in small steps. Record the force at failure, then note how it failed. Did the crack cross the printed lines, or did the layers peel apart from each other?
Upright samples usually need supports or a brim, which is a real planning problem and worth reporting honestly. Say so in your limitations. The lesson here is one most beginners never learn: a part's shape is not the only design decision. The direction it was printed changes how it handles force. That surprises people.
4. Wall thickness versus impact resistance
Question: how does wall thickness affect the impact resistance of a hollow printed container?
Test one, two, three, and four wall lines. Print small matching boxes or shells. Keep them identical. Hold model size, infill, material, layer height, and orientation constant.
Build a repeatable drop test. Same weight, released from set heights, onto the same point of each sample. Define failure before you start. A visible crack longer than five millimetres is a clean rule. Write it down first. Record the lowest height that causes it.
Weigh each part and log its print time. Four wall lines might survive a taller drop while using noticeably more plastic and machine hours. Whether that trade is worth it is the question your conclusion should answer. Answer it with numbers. An adult should run the drops and keep hands and faces away from the impact point.
|
WHY STRENGTH PROJECTS SCORE WELL They produce numbers on the first afternoon of testing, not on day five. The failure is visible, so photographs do real work on the board. The samples are small, which keeps print time and filament cost low. One printed batch can serve two graphs: performance, and performance per gram. |
Motion, Sound, and Mechanical Design Projects

5. Propeller blade pitch versus airflow
Question: how does propeller blade pitch affect airflow speed at a fixed motor speed?
Print propellers at 10, 20, 30, and 40 degrees of blade pitch. Match diameter, blade count, blade width, and material. Only pitch changes. Mount each one on the same motor the same way, and keep the measuring position and distance fixed.
An anemometer gives clean readings in metres per second. Without one, a lightweight ribbon and a measured deflection works, though the data is softer. Run each propeller for the same length of time and stop the motor between tests so heat does not creep into your results.
Steeper is not automatically stronger. A blade that bites too hard can load the motor down and slow it. That result is more interesting than a straight line, and explaining it earns points.
6. Spinning-top weight distribution versus spin time
Question: how does weight distribution affect the spin time of a printed top?
Design three tops with the same total mass but the mass in different places. One concentrated near the centre. One with a heavy outer ring. One spread evenly. Match height, tip shape, diameter, filament, and mass as closely as you can.
Hand spins are the weak point of this project. Two students will never launch a top the same way twice. Neither will one. A simple printed pull-cord or geared launcher fixes it, and building one is itself a nice piece of engineering to photograph.
Time from release until the top falls past a defined angle. Same flat surface, several trials each. Slow motion video helps you spot the moment each top loses stability, which is often more revealing than the raw seconds.
7. Gear ratio versus lifting speed and force
Question: how does gear ratio affect the time needed to lift a fixed load?
Compare 1:1, 2:1, and 3:1. Print gears with matching tooth profile and thickness so they mesh properly. Test the fit first. Reuse the same frame, axle, string, spool, and crank or motor for every setup.
This project gives you two dependent variables, which is unusual and useful. Measure how long each ratio takes to raise a set load through the same vertical distance. Then measure the heaviest load each ratio can lift at all.
The pattern is predictable. That is fine. Fast setups struggle with heavy loads. Slow setups handle weight but take longer. Showing the trade with numbers beats stating it from a textbook. Shield the moving gears. A clear cover keeps fingers out without hiding the mechanism from judges.
8. Resonator tube length versus sound pitch
Question: how does the length of a printed resonator tube affect its loudest frequency?
Print tubes at 50, 75, 100, and 125 millimetres. Hold inside diameter, wall thickness, opening shape, and filament constant. Only length changes.
Produce sound the same way each time, either by blowing across the opening or by playing one speaker tone near each tube. A phone frequency analyser identifies the strongest measured frequency. Same phone. Same app. Same settings. Same room. Several readings per tube.
Background noise and microphone distance will move your numbers. Say so. If one tube refuses to produce a clear tone, record that instead of hiding it, then work out whether the opening shape, the wall surface, or your sound source was the limit. This is one of the cheapest projects on the list and one of the fastest to print.
Light, Friction, and Environmental Science Projects
9. Pinhole diameter versus image sharpness
Question: how does pinhole diameter affect the sharpness of a projected image?
Print interchangeable front plates with different opening sizes. One catch. Most nozzles cannot produce a clean, perfectly round hole below about a millimetre. Use thin foil for the actual aperture and let the printed body hold each foil insert in exactly the same position.
Keep box length, screen material, light source, viewing distance, and room lighting fixed. Aim at the same high-contrast target and photograph the projected image with locked camera settings from a fixed position.
Score sharpness by how clearly two nearby lines stay separate. Compare brightness using pixel values from the same photo tool. Expect a trade-off rather than a winner. Larger openings brighten the image. Smaller ones sharpen it. That holds until diffraction and dimness take over.
10. Surface texture versus sliding friction
Question: how does printed surface texture affect the angle at which an object starts to slide?
Print ramps that differ only in surface pattern. Smooth, lined, dotted, crosshatched. Same size. Same thickness. Same filament. A printer can produce controlled micro-textures that are almost impossible to make by hand, which is what makes this experiment worth doing with a printer at all.
Place the same test block at the same starting point. Raise one end slowly until the block moves. Record the angle. Measure the angle with a digital angle finder or a phone level.
Clean the surfaces between trials and handle them as little as possible. Dust, skin oil, and stray plastic strands all change friction. Invisibly, too. Graph texture type against average starting angle. A higher angle means the surface resisted sliding for longer.
11. Terrain slope versus soil erosion
Question: how does terrain slope affect the amount of soil lost during rainfall?
Print matching trays at 5, 15, 25, and 35 degrees. Match length, width, surface pattern, drainage opening, and wall height. Nothing else varies. Add the same mass of the same dry soil to each.
Rainfall must be repeatable. Otherwise the whole thing collapses. A bottle with small holes or a controlled spray nozzle, same volume, same height, same duration. Collect the runoff underneath. Filter, dry, and weigh the soil that washed away, or let the sediment settle and measure it.
Several trials per slope. Replace and prepare the soil identically each time. Graph slope against soil loss. In your discussion, name what the model leaves out: plant roots, ground cover, soil type, and real rainfall intensity all matter outside a plastic tray.
12. Wick opening size versus soil moisture
Question: how does wick opening size affect soil moisture in a printed self-watering planter?
Print identical planters or inserts with small, medium, and large wick openings. Same filament. Same soil mass, water volume, wick material, and room location.
Measure moisture at the same depth and the same time each day. A moisture meter gives direct readings. Weighing each planter tracks water movement too, as long as you account for container and soil mass.
Run it long enough for a pattern to appear. Several days, sometimes more. Test without plants first. A growing plant adds natural variation that hides the effect of the printed design, and isolating that design is the whole point. This project needs the least printing on the list and the most patience.
|
MATCHING THE PROJECT TO THE PRINTER YOU HAVE Build volume decides which of these twelve are open to you. A 120 mm cube handles beams, tubes, tops, gears, ramps, and planter inserts without trouble. A 150 mm cube adds full bridge spans and erosion trays you do not have to print in sections. Material matters too. Projects 4 and 7 benefit from PETG or ABS, which needs a heated bed. Families deciding between models can compare kids' 3D printers by age and build size before committing to a project that will not fit on the plate. Age fit is worth a thought as well. Ages 4 to 12 works better with guided one-touch printing and a simpler app. Ages 9 to 16 can handle saved profiles, orientation choices, and a second material, which is exactly what these experiments ask for. |

How to Run a Fair and Reliable Experiment
Test one variable at time
Change infill, filament, and wall thickness together and your data cannot tell you which one mattered. That is the single most common way a good idea turns into an unscoreable project. It happens constantly.
List every setting and condition before you print. Mark the independent variable. Treat the rest as controls. Leave them alone.
Record accidents too. A sample printed at a different temperature, or from a second spool, gets labelled and flagged. Then decide whether to keep it. And say why. One project does not have to answer every question about a design. Save the second variable for next year.
Run at least three trials per design
A single test can go wrong for reasons that have nothing to do with your variable. A hidden void, a slipped ruler, a support that was not fully removed. Repeats separate a real pattern from noise. That is all.
Three per condition is the floor. No lower. More is better when print time and filament allow it. Give every sample its own code so nothing gets mixed up on the testing table.
Fresh prints for destructive tests. A bar you already bent is no longer the same bar. Report every valid result, including the ones that ruin your neat pattern. An outlier often turns out to be evidence of a print defect, and saying so is stronger than deleting the row.
Measure with the same tools and method
One scale. One timer. One ruler. One microphone. One moisture meter. Switching devices mid-project introduces a difference you did not intend to study.
Measure from the same place every time. Soil moisture at the same depth and the same distance from the wick. Load at the same point on the span.
Define when a test starts and stops. For a spinning top, timing might begin at release and end when it tips onto its side. Where judgement is involved, write the rule down first. Practise the method once before you collect real data. A dry run exposes problems with timing, loading speed, and camera position. It costs nothing.
Record failed prints and unexpected results
Failed prints are data. They tell you something about settings, geometry, or preparation.
Log the sample code, the failure type, the settings, and your best guess at the cause. Poor bed adhesion. Layer separation. Stringing. Warped corners. Missing sections. If your failure rate is high, that is a finding about how practical the design is, even if the surviving samples performed well.
Odd results deserve the same attention. If a thinner wall survives a taller drop than a thicker one, go back and inspect both parts before you rewrite anything. The goal is not to make the data match the hypothesis. Never was. The goal is to explain what the evidence shows and say what you would test next.
How to Analyse and Present Your Results
Calculate averages and compare them
Add the valid trials for one condition, divide by the number of trials. Three bridges holding 8, 9, and 10 pounds average out to 9 pounds. Keep the individual numbers in the table anyway.
Then read across the conditions. Look for the highest and lowest values, sudden jumps, and groups that sit close together. Range is worth calculating too. Subtract the lowest result from the highest inside one group. A narrow range says your trials were consistent. Show it.
Never drop a result just because it moves the average. Exclude data only for a stated reason, like a broken tool or a sample printed on the wrong setting, and write that reason down.
Choose the right graph for your data
Bar graphs suit separate groups. Bridge designs. Surface textures. Orientations. One bar per group average.
Line graphs suit ordered numbers. Infill percentage. Tube length. Slope angle. Wall count.
Title the graph so it states what is being compared. Label both axes with units, like "Infill Density (%)" and "Average Breaking Load (lb)". Start the scale somewhere sensible and use equal intervals, because a truncated axis makes a small difference look enormous and judges notice. Put the graph next to the table it came from. The table carries the exact numbers, the graph carries the pattern.
Explain whether the hypothesis was supported
Answer your research question directly. Name the condition that produced the highest, fastest, strongest, or steadiest result, and give the number.
Use "supported" or "not supported" rather than "proven". Then explain the pattern using a physical idea. A truss spreads force through its joints. A longer tube supports a lower pitch. A rough surface resists sliding for longer.
No new results in the conclusion. Every claim you make here should point back to a number already shown in the results section.
Discuss errors, limits, and what you would change
Every experiment has boundaries. All of them. Naming them makes you look more careful, not less.
An error is something that went wrong during testing. A limitation is a boundary you chose, like using a single filament type or only three trials per condition. Both belong on the board.
Then say what you would fix. Print more samples. Use a digital force gauge instead of stacked weights. Build an automatic launcher. Widen the range of settings. Point at a specific weak step. Writing "I would be more careful next time" tells a judge nothing.
Organise the display board and check what you can bring

Readers scan a board in a fixed order: title, question, main graph, conclusion, photos. Build it that way.
- Title, research question, and hypothesis
- Background and variables
- Materials and procedure
- Data tables, graphs, and observations
- Conclusion, limitations, and next steps
Now the part almost nobody checks until it is too late. Fair rules restrict what you may physically display. The Society for Science display and safety rules cap a project at 76 cm deep, 122 cm wide, and 240 cm tall, and they ban liquids of any kind, soil, sand, rock samples, glass, sharp items, and moving parts with unshielded pinch points. That affects several projects on this list directly. Your erosion trays and moisture planters cannot travel wet, your gear rig needs a proper guard, and your soil has to stay home.
The same rules bar QR codes, web addresses, and commercial logos from the board, and they require that every graph, chart, and photo you made be individually cited with the software and year. Graphics made with AI need their own citation. Rules change annually, so read the current International Rules for Pre-college Science Research and your local fair guidelines before you print the poster. Photograph anything you cannot bring. A good photo of a snapped truss beats an empty spot on the table.
Prepare for questions from the judges
Judges usually ask the same handful of things. Why this topic. How you kept it fair. What the data showed. How many trials you ran.
Know your independent variable, dependent variable, and main controls without looking them up. Be ready to talk about a failed print or a strange measurement, because an honest explanation lands better than a dodge.
Practise these five:
- Why did you choose those test values?
- What result surprised you most?
- How did you keep the experiment fair?
- What would you change in a future test?
- Where could this result be useful in real life?
Bring one or two printed samples if the rules allow it. Holding up a bar and pointing at the layer lines explains orientation faster than any paragraph. Do not memorise a speech. Understand the question, the method, the data, and the conclusion well enough to talk through them.
How to Pick the Right Project for Your Deadline
Choose a strength or structure project when
- Your deadline is under three weeks and you need data quickly
- You have a printer but no anemometer, motor, or frequency app
- You want failures you can photograph clearly
- An adult is available to supervise loading and breakage
- You would rather test a slicer setting than build a rig
- Projects 1, 2, 3, and 4 fit here. Project 2 is the easiest start.
Choose a motion, light, or environmental project when
- You have four weeks or more and can run trials over several days
- You already own a motor, meter, phone app, or angle finder
- You want a topic that connects to weather, sound, or optics
- You enjoy building test equipment as much as testing
- Your fair allows a demonstration, or you can film one instead
- Projects 5 through 12 fit here. Projects 8 and 10 need the least gear.
Conclusion

A strong 3D printing science fair project starts with a question, not a finished object. Change one factor. Measure one clear result. Repeat the test. Explain what the numbers mean.
Small samples do this better than showpieces. A beam, a gear, a tube, a ramp, or a planter insert will carry a project further than a large model that took eleven hours and answers nothing. Keep the method steady. Label everything. Log the failed prints. Label your axes.
Pick the project that fits your skills, your equipment, and your calendar, then check your school and fair safety rules before you print or test anything. If the printer is still on the shopping list, AOSEED's family-friendly 3D printing platform is built around this kind of repeat use rather than one weekend of novelty. X-MAKER covers ages 9 to 16 with a 150 mm cube build area, 0.05 mm layer precision, PLA and ABS support on a heated bed, a 3.5 inch touchscreen, and 16-point auto-levelling, and it is currently listed at $369, down from $509. X-MAKER JOY sits at $259, down from $339, for younger beginners on PLA. Both come with a 30-day trial in the US.
One question, one variable, three trials. That is the project.
FAQs
What are common mistakes beginners make in 3D printing?
The biggest one is starting a large model before checking the first layer, the filament path, and the slicer profile. That leads to poor bed adhesion, weak parts, under-extrusion, stringing, or a print that collapses after four hours. Other frequent errors include running the nozzle too cold or too hot, printing too fast, ignoring where supports are needed, and changing several settings at once so nothing can be diagnosed. Science fair students add two of their own: forgetting to label samples as they come off the plate, and failing to save the exact settings used for each test group. Practical tip: print one small calibration square and confirm the first layer sticks evenly before you commit to a full batch of experiment pieces.
What are the common mistakes to avoid in a science fair project?
Choosing a question that cannot be measured, changing more than one variable, and running a single trial. Any one of those makes it impossible to say what caused your result. Students also lose marks for hiding failed tests, adjusting the procedure partway through without recording the change, and writing a conclusion based on what they expected rather than what they measured. A fair experiment changes the independent variable while holding every controlled variable the same across all trials, and the procedure should state exactly how the dependent variable gets measured. Missing paperwork or breaking fair safety rules can disqualify a project even when the data is excellent. Practical tip: have a teacher review your question, variables, procedure, and safety plan before you print a single test sample.
What are three things you should never do when using a 3D printer?
Never touch the nozzle, heater block, or heated bed while the printer is running or still cooling. Never put fingers, loose clothing, hair, or tools near moving belts, fans, gears, and the print head. Never run a filament printer in a closed, unventilated space, because EPA research reports releases of volatile organic compounds and ultrafine particles, and NIOSH recommends enclosures, ventilation, and reduced time spent beside the machine. A fourth rule is worth adding: never keep printing through smoke, a strong unusual smell, damaged wiring, or movement that will not stop. Shut it down and get an adult. Practical tip: put the printer in a supervised, ventilated room and follow the safety instructions that came with your specific model.
What's the first thing I should 3D print?
A first-layer calibration pattern. It is small, it finishes fast, and it tells you whether the nozzle sits at the right height and whether filament is sticking evenly across the plate. After that, a simple cube, a flat name tag, or a small benchmark model makes a good first complete object. Pick something with a broad base, few overhangs, and little or no support material, so you can watch adhesion, extrusion, cooling, and motion without risking hours of filament. For a science fair project, do not count that first test as an official sample unless it was printed on the exact settings your final batch will use. Practical tip: save the successful profile before you slice any experiment pieces.
What is the 5 second rule in science fair?
It usually refers to a food experiment asking whether food is still safe after touching the floor for under five seconds. It is not a judging rule and it does not control how projects are scored. A student could compare contact times, food types, or floor surfaces, but the project involves unknown microorganisms. Society for Science rules prohibit culturing potentially hazardous biological agents, including unknown microorganisms, in a home setting. Projects involving microbial cultures may require advance approval, a suitable laboratory, trained supervision, and specific disposal procedures, and nobody should open, smell, or handle a plate once growth appears. For most middle school students, a non-biological experiment is the better choice. Practical tip: check your fair biological research rules before buying agar plates.
What makes a science fair project fail?
No testable question, no controlled procedure, too little data, or a conclusion that does not answer what was asked. A creative display cannot rescue an unfair experiment. Projects also weaken when students change several factors together, use different measuring methods across trials, run too few repeats, or quietly remove results that contradict the hypothesis. Judges want to see how the independent variable changed, how the dependent variable was measured, and what stayed constant. Charts should reveal patterns rather than decorate the board. Some projects fail to qualify for a procedural reason instead, because restricted work started before approval came through. Practical tip: work from a checklist covering approval, repeated trials, complete data, labelled graphs, and a conclusion supported by measurements.
What's the easiest science fair project?
For 3D printing, the infill density versus part strength test. It uses one model file while changing a setting that takes two clicks in slicer software. Print identical beams at 10, 30, 50, and 70 percent infill, rest each beam across matching supports, and add weight in equal steps until it bends or breaks. The result is a number, which graphs cleanly as a bar or line chart, and one printed batch also gives you sample mass, filament use, and print time for a second comparison. The real work is consistency: wall count, layer height, material, orientation, temperature, and load position all have to stay fixed. Print several copies per setting, because one hidden void can skew a breaking result. Practical tip: use small beams and three trials per infill setting to keep it manageable.
What are you not allowed to 3D print?
Anything that breaks the law, infringes someone else's intellectual property, violates school rules, or fails your fair's safety requirements. The specifics depend on the object, its intended use, and federal, state, and local law. Downloading a file does not by itself grant permission to reproduce or sell a design. The U.S. Copyright Office notes that copyright protects original creative expression rather than facts, ideas, systems, or methods of operation, while trademarks identify the source of goods and patents cover qualifying inventions, so a popular brick shape can be tangled in more than one form of protection. Weapon components sit under separate law: ATF guidance on privately made firearms notes that a firearm may be produced by 3D printing only if it remains detectable as defined in the Gun Control Act, while destructive devices and machine gun conversion devices are illegal to possess without proper licensing and can carry a prison sentence of up to ten years. State and local rules can be stricter. Also avoid printing pressure vessels, food-contact items, medical devices, or load-bearing parts without qualified guidance. Practical tip: use original or properly licensed educational models, and ask a teacher before printing anything that could be dangerous or legally restricted.
Sources
- U.S. Environmental Protection Agency, “3D Printing Research at EPA”
- National Institute for Occupational Safety and Health, “3D Printing with Filaments: Health and Safety Questions to Ask”
- Society for Science, “International Rules for Pre-college Science Research”
- Society for Science, “Display & Safety Rules”
- U.S. Copyright Office, “Copyright in General (FAQ)”
- Bureau of Alcohol, Tobacco, Firearms and Explosives, “Privately Made Firearms”




Further reading

Thanksgiving STEM Activities for Kids: Table Projects and Simple Engineering Challenges

Halloween STEM Activities for Kids: Spooky Builds That Teach Real Science

STEM Crafts for Kids: Build, Decorate and Test