3D Printed Cartesian Plane Lesson Plan: Math and Technology Integration for Grades 5 to 8
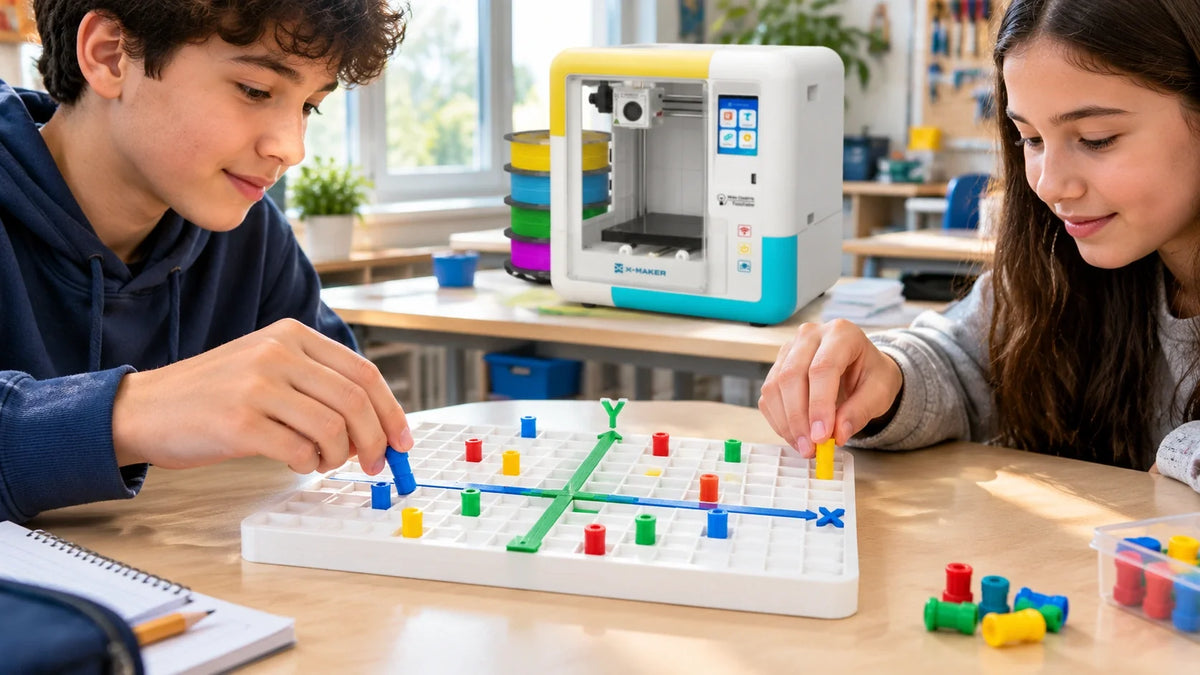
Ordered pairs trip up a lot of students for one simple reason. On paper, a point is just a dot, and a dot in the wrong square looks almost the same as a dot in the right one. A 3D printed Cartesian plane changes that. The axes are raised, the origin can be felt, and every plotted point is a peg a student can pick up and move.
This plan is written for Grades 5 to 8. It covers the printable grid, a timed 60 minute procedure, seven follow up activities, grade level adjustments, and a short bridge from x and y to the z axis a 3D printer uses every time it builds a layer.
Lesson at a Glance
|
Item |
Details |
|
Grade band |
Grades 5 to 8 (first quadrant in Grade 5, all four quadrants from Grade 6) |
|
Time |
60 minutes, plus one print session the day before |
|
Core standards |
CCSS 5.G.A.1, 5.G.A.2, 6.NS.C.6, 6.NS.C.8, 8.G.A.3 |
|
Printed parts |
1 grid board and 12 pegs per pair |
|
Key activity |
Coordinate Drop, then a hidden shape reveal |
|
Technology link |
How a 3D printer moves along X, Y and Z |
|
Assessment |
Partner route checks plus a two question exit ticket |
What a 3D Printed Cartesian Plane Lesson Teaches
The lesson uses a printed coordinate board as a math manipulative. Students learn the same content found in any coordinate unit. The difference is that each idea gets a physical action attached to it.
The Cartesian Plane in Plain Terms
The Cartesian plane is a flat grid made by two number lines that cross at a right angle. Any point on it can be named with two numbers. That pair works like a street address: it tells you exactly where to go, not roughly.
Axes, Origin, and Ordered Pairs
The horizontal line is the x axis. The vertical line is the y axis. They meet at the origin, (0, 0). An ordered pair such as (3, 5) always reads x first: move 3 along the x axis, then 5 along the y axis. Swap the numbers and you get (5, 3), a different point.
On a printed board, students can put one peg on (3, 5) and a second on (5, 3). The gap between the two pegs explains why order matters faster than any rule written on the whiteboard.
The Four Quadrants and Their Signs
|
Quadrant |
Position |
x sign |
y sign |
Example |
|
I |
Upper right |
+ |
+ |
(4, 3) |
|
II |
Upper left |
− |
+ |
(−4, 3) |
|
III |
Lower left |
− |
− |
(−4, −3) |
|
IV |
Lower right |
+ |
− |
(4, −3) |
Points that sit on an axis, such as (0, 5) or (−2, 0), belong to no quadrant. Students miss this more often than any sign rule, so plan at least one axis point per round.
Why a Printed Grid Works Better Than Graph Paper

Paper graphing asks students to hold the whole system in their heads. A printed board splits the job into steps they can see and feel.
|
Where students struggle |
On graph paper |
On a printed board |
|
Finding the origin |
A small dot among dozens of lines |
A raised ring or larger hole at (0, 0) |
|
Keeping x before y |
Easy to forget once the pencil moves |
Finger traces the x axis first, then the y axis |
|
Fixing mistakes |
Erase, redraw, often smudged |
Lift the peg and move it |
|
Comparing two points |
Hard to see side by side |
Both pegs stay on the board together |
|
Partner checking |
Checker reads someone else's handwriting |
Checker retraces the route with a finger |
|
TEACHER TIP Print the origin marker in a different color from the grid. Students find (0, 0) in about a second, and every route starts from the same place. |
Learning Objectives and Standards for Grades 5 to 8
Grades 5 to 8 cover a wide spread of skill. Match the objective to the standard the class is working on now instead of teaching all four grades the same way.
|
Grade |
Students will be able to |
Standard |
|
5 |
Name the axes and origin; plot and read points in the first quadrant |
5.G.A.1, 5.G.A.2 |
|
6 |
Use signs to place points in all four quadrants; spot reflections across an axis |
6.NS.C.6, 6.NS.C.8 |
|
7 |
Build polygons from coordinate lists; find horizontal or vertical distances |
6.NS.C.8 applied to Grade 7 geometry |
|
8 |
Describe reflections and translations of shapes using coordinates |
8.G.A.3 |
The Grade 5 wording comes from the Common Core Grade 5 geometry standards, which define a coordinate system built on two perpendicular axes that meet at zero. The Grade 6 number system standards add negative values and state that two points differing only by sign are reflections across one or both axes.
Whatever the grade, every student should leave able to point to the origin, say which number comes first, and describe the route to a point out loud.
Materials and Print Prep
Print everything the day before. Waiting on a printer during class eats the time students should spend plotting.
|
Item |
Suggested spec |
Per pair |
Notes |
|
Grid board |
110 × 110 mm, 10 mm spacing, axes from −5 to 5 |
1 |
Axes raised about 1.5 mm above grid lines |
|
Peg holes |
5 mm hole at every intersection |
121 |
Keeps pegs upright |
|
Point pegs |
4.6 mm shaft, 8 mm head |
12 |
Print in 2 or 3 colors |
|
Origin marker |
Ring or larger hole at (0, 0) |
1 |
Different color from the grid |
|
Challenge cards |
Paper, 3 difficulty levels |
1 set |
First quadrant, four quadrant, reflection |
|
Rubber bands or string |
Classroom supply |
4 |
For connecting points |
|
Mini whiteboard |
Classroom supply |
1 |
For the exit ticket |
Sizing the Board for Your Printer
A 110 mm board fits inside the 120 × 120 × 120 mm build volume of the X-MAKER JOY and leaves spare room on the 150 × 150 × 150 mm X-MAKER. Keep the board around 3 to 4 mm thick so it prints flat. Pegs are small, so a full class set can go on the plate in a few batches.
|
PRINT CHECK Test one peg in one hole before printing the class set. Holes often print slightly smaller than designed, so a 0.2 to 0.4 mm gap between peg and hole is a sensible starting point. Pegs are small parts. Count them back in at the end of class and keep loose ones away from younger children at home. |
Classroom Setup
Pairs work best. One student calls a coordinate, the other plots it, and they switch every five points. A group of three can add a checker whose only job is to retrace the route from the origin and say what moved first. Put cards and pegs within reach so nobody crosses the room mid task.
The 60 Minute Lesson Procedure
 The sequence moves from vocabulary to guided plotting and ends with an independent check. Classes that already know ordered pairs can shorten the first two steps and spend the extra time on the shape reveal.
|
Minutes |
Step |
Teacher |
Students |
|
0 to 5 |
Hook |
Asks how a game knows where a character stands |
Guess, then hear the word coordinates |
|
5 to 12 |
First look at the board |
Hands out boards and pegs |
Trace the axes, find the origin |
|
12 to 18 |
Axes and origin |
Calls terms, then points and asks for names |
Point, name, place a peg at (0, 0) |
|
18 to 25 |
Quadrants |
Places one unlabeled peg per quadrant |
Predict the signs for each peg |
|
25 to 40 |
Coordinate Drop |
Calls pairs, mixing signs and axis points |
Plot, then partner checks the route |
|
40 to 50 |
Hidden shape |
Hands out a coordinate list |
Plot, predict, connect with bands |
|
50 to 60 |
Exit ticket |
Places one hidden peg |
Write its pair and quadrant |
Hook and First Look (Minutes 0 to 12)
Ask how a video game knows exactly where a character is standing. Let a few guesses land, then sketch two crossing number lines. Keep it short.
Hand out the boards and give students a full minute to handle them before any vocabulary. Ask what they recognize from graph paper, then what the board lets them do that paper cannot.
Axes, Origin, and Quadrants (Minutes 12 to 25)
Call a term and have everyone point to it. Then flip it: you point, they name. Place a peg directly on the x axis and ask which quadrant it is in. The pause that follows is the whole point.
For Grade 6 and up, set one peg in each quadrant without saying its coordinates. Students predict the sign of x and y for each one. Grade 5 classes stay in Quadrant I.
Coordinate Drop (Minutes 25 to 40)
Call a pair, give students a few seconds, then ask one student to describe the route. A good answer sounds like this: start at the origin, left 4 because x is negative, then up 3. Use sets that reveal a pattern:
• (2, 4) then (−2, 4): only the x sign changed, so the peg jumps across the y axis
• (2, −4) then (−2, −4): both values are now negative, Quadrant III
• (0, 3) and (3, 0): axis points with no quadrant, a quick trap worth setting
Hidden Shape Reveal (Minutes 40 to 50)
 Give pairs this list and ask them to guess the shape before stretching the final band: (−4, 1), (1, 1), (1, 3), (5, 0), (1, −3), (1, −1), (−4, −1), then back to (−4, 1). It forms an arrow pointing right and touches all four quadrants, so one sign error bends the arrow in an obvious way.
For Grade 5, use a house that stays in Quadrant I: (2, 1), (8, 1), (8, 5), (5, 8), (2, 5), then back to (2, 1).
Exit Ticket (Minutes 50 to 60)
Set one peg where everyone can see it. Students write its ordered pair and quadrant on a mini whiteboard, plus one sentence on how they knew. Sort the answers by mistake type, not by score. Swapping x and y calls for a different next lesson than confusing negative signs.
Seven Activities That Reuse the Same Board
Once the boards exist, a new activity costs nothing but a fresh set of cards. These seven run from Grade 5 practice up to Grade 8 transformation work.
|
Activity |
How it works |
Best for |
Time |
|
Coordinate Drop |
Caller reads a card, plotter places a peg, both check the route |
Grades 5 to 6 |
10 min |
|
Mystery Point |
Teacher places a peg; students write its pair and quadrant |
Grades 5 to 7 |
5 min |
|
Quadrant Sort |
Sort cards by quadrant using signs only, then plot a sample to test |
Grade 6 |
10 min |
|
Treasure Hunt |
Clues such as 'x is negative' narrow the board to one point |
Grades 6 to 7 |
15 min |
|
Blind Partner Plot |
One student sees a design and describes it only in coordinates |
Grades 6 to 8 |
15 min |
|
Reflection Pairs |
Plot (3, 2), predict its mirror across an axis, place a second peg |
Grades 6 to 8 |
10 min |
|
Design Your Own Picture |
Write an 8 to 12 point picture for a classmate to rebuild |
Grades 7 to 8 |
20 min |
Reflection Pairs lines up with the Grade 6 expectation above: when two points differ only in sign, they mirror each other across one or both axes. Keep both pegs on the board so students can see what stayed the same. For Grade 8, slide a whole shape three units right and compare old and new coordinates to describe the translation.
|
The Blind Partner Plot tends to be the most revealing activity. When the rebuilt picture comes out wrong, the pair has to work out whether the error was in the words or the plotting, and that conversation usually fixes the misconception for both of them. |
Connecting Coordinates to How a 3D Printer Works
The board itself is the best technology example in the room. It was built from coordinates.
From Ordered Pair to Print Head
NIST describes additive manufacturing as building parts up layer by layer instead of cutting material away. For each layer, the printer moves across X and Y to trace the shape. Then it steps along Z and starts the next layer.
Ask students what their flat board would be missing if it had to describe the height of a peg. That one question introduces z better than a diagram does.
Letting Students Design the Pegs
Peg design makes a manageable first CAD task. In Tinkercad, a free design app from Autodesk, students can build a peg from two cylinders in a few minutes. The math shows up right away: the shaft must be narrower than the hole, the head must be wider, and both need exact numbers.
• Set a rule: shaft no wider than 4.6 mm, head no wider than 9 mm so neighboring pegs still fit
• Print two or three student designs and test them in the board
• If a peg jams, measure both parts, change the model, and print again
That measure, adjust, test loop is the same design cycle engineers use, and it grows straight out of the coordinate lesson.
Choosing a Classroom Printer
For Grades 5 to 8, the printer should be simple enough for students to send their own peg designs. The AOSEED X-MAKER is built for ages 9 to 16, which covers this whole grade band. Its 150 × 150 × 150 mm build area fits a full coordinate board, it prints at up to 300 mm/s, and the AOSEED App gives students thousands of ready to print models plus 15+ in app design games.
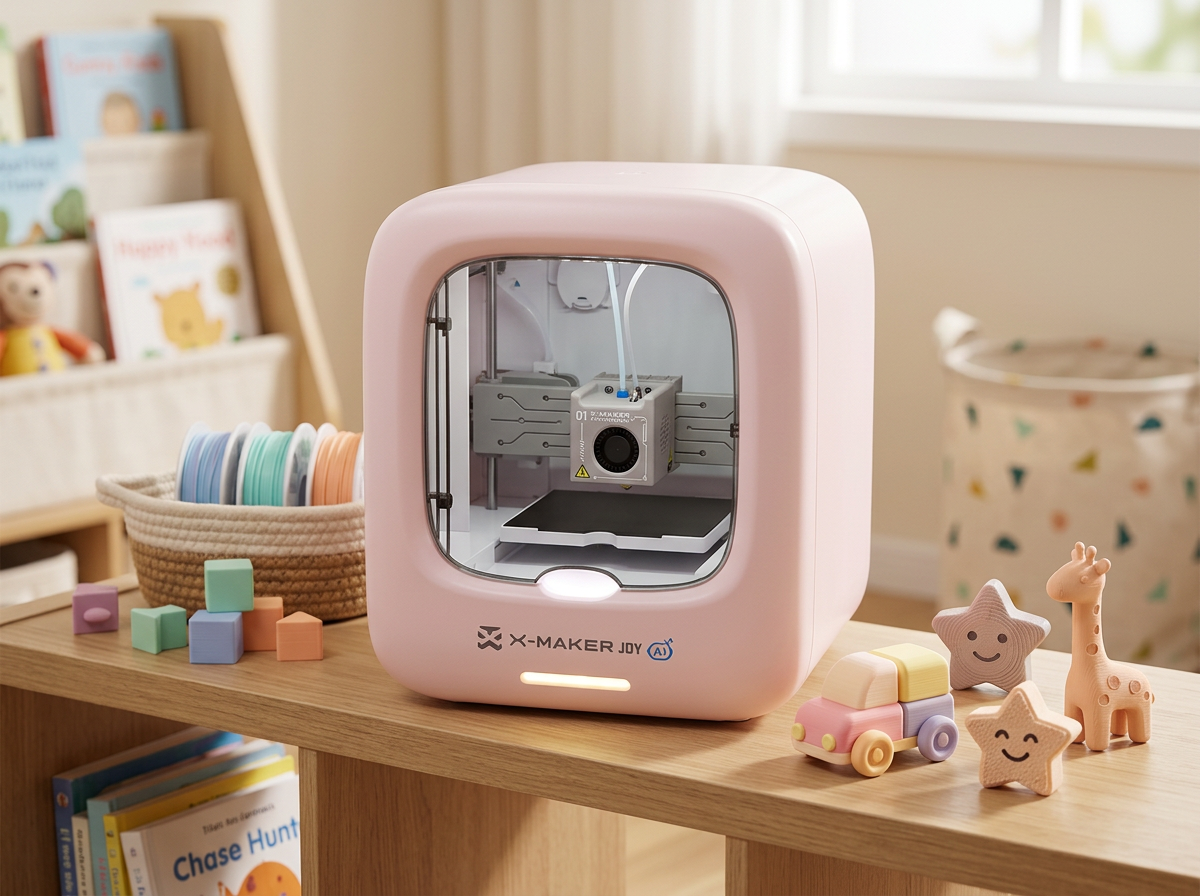
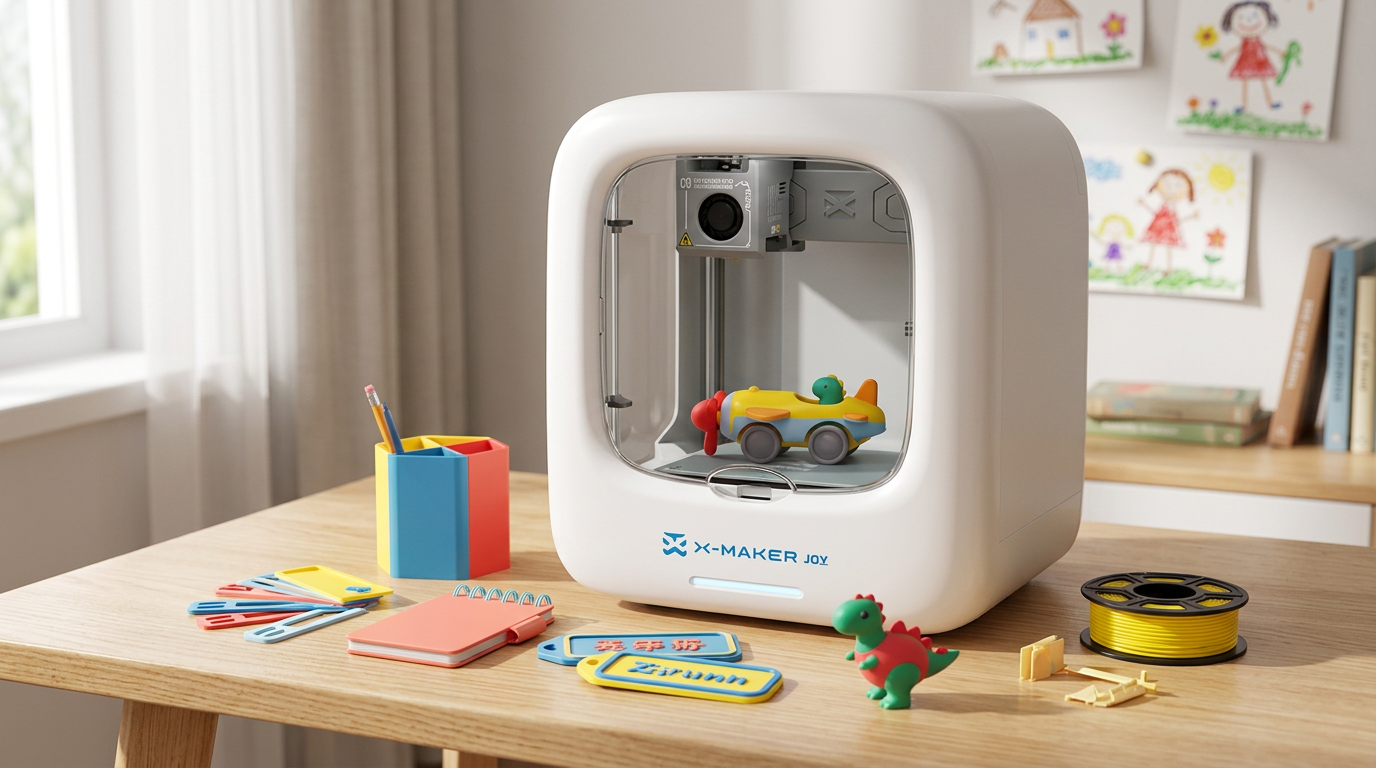
Teachers who want a STEM 3D printer for older kids can print the boards once and then hand the design work to students. Younger or first time groups may prefer the X-MAKER JOY, which is fully enclosed, prints with one tap from the app, and is listed for ages 4 to 12.
Where Else Students Meet Coordinates
Students always ask when they will use this. Four quick answers work well with this age group:
• Video games: every character and camera has a position that changes as it moves
• 3D design and printing: every corner of a model is a set of numbers before it becomes plastic
• Maps and GPS: latitude and longitude give a numerical address, though on a curved Earth rather than a flat grid
• Medical scans: CT and MRI images are stacked slices, located by height the way z locates a layer
|
PRINT THE WHOLE CLASS SET ON ONE PRINTER AOSEED builds kids' printers around guided apps and ready made projects, so a teacher can move from printed math manipulatives to student designed parts on the same machine. Both models, with their age ranges and build sizes, sit side by side when you compare kids' 3D printers. |
Adapting the Lesson by Grade
The board stays the same across all four grades. The coordinates, the questions, and the amount of student design work change.
|
Grade |
Focus |
Sample coordinates |
Stretch task |
|
5 |
First quadrant only, x before y |
(2, 5), (5, 2), (0, 4) |
Build the house shape |
|
6 |
Negatives, four quadrants, reflections |
(4, 2), (−4, 2), (4, −2), (−4, −2) |
Arrow shape, Reflection Pairs |
|
7 |
Polygons, horizontal and vertical distance |
(−3, 2) to (4, 2) is 7 units |
Write a shape for another group |
|
8 |
Translations and reflections by rule |
(1, 2) → (4, 2) → (4, −2) |
Design and print a peg |
Support for Students Who Need More Practice
Cut down the decisions. Start at the origin, stay in one quadrant, and use whole numbers only. Tape a small card by the board that reads x first, y second. Have the student say each move while making it: x is negative, so left.
Extensions for Advanced Students
Remove the axis labels and ask students to rebuild the scale from the origin. Give a clue set with two valid answers and ask for both. Or set a design brief: a quadrilateral that crosses three quadrants and has one line of symmetry.
Extending From 2D to 3D Coordinates
 The printed board makes the jump to three dimensions unusually concrete. Hold a peg above (3, 2). Its x and y have not changed, but its position in space has. The missing number is z.
|
Feature |
2D plane |
3D space |
|
Axes |
x, y |
x, y, z |
|
Point notation |
Ordered pair (3, 2) |
Ordered triple (3, 2, 4) |
|
Origin |
(0, 0) |
(0, 0, 0) |
|
Regions |
4 quadrants |
8 octants |
|
Classroom model |
Peg on the board |
Stacked pegs or cubes above the board |
Stack pegs or snap cubes on one intersection to show z levels. Ask students to compare (3, 2, 1) with (3, 2, 4): same spot on the floor, different height. Only the first octant, where all three values are positive, has a number every textbook agrees on, so skip octant numbering and focus on signs.
Assessing Student Understanding
 A correct peg does not always mean correct thinking. Listen to the route a student describes, not just where the peg lands.
|
Common mistake |
What you will see |
Quick fix |
|
Swaps x and y |
(2, 5) plotted at (5, 2) |
Plot both pairs side by side and compare |
|
Counts from the board edge |
Points shifted by one or two units |
Every route starts with a finger on the origin |
|
Ignores negative signs |
Quadrant II points land in Quadrant I |
Say the direction before moving: negative means left |
|
Puts axis points in a quadrant |
Calls (0, 3) Quadrant I |
Add one axis point to every round |
|
Rushes the shape reveal |
A bent or broken arrow |
Check each peg against the list before connecting |
For a written check, two items are enough: one plotted point to name and one pair to plot on a small paper grid. Add one reflection prompt: what still feels unclear, and how does the printer use coordinates? The answers show whether the next lesson needs more board time or is ready for design work.
When to Use the Printed Board and When to Use Paper
Reach for the printed board when:
• Students are meeting ordered pairs or negative coordinates for the first time
• Several students keep swapping x and y
• You want partner work where both students must talk through a route
• The class is ready to link coordinates to 3D design and printing
Stick with paper or digital graphing when:
• Students need to graph lines, functions, or large data sets
• Coordinates run past the board's range, such as (25, −40)
• Time is short and the skill is already secure
• You need a written record of work for grading
Conclusion
A 3D printed Cartesian plane turns ordered pairs into something students can hold, move, and argue about with a partner. One print session gives a class a board that supports first quadrant practice in Grade 5, reflections in Grade 6, and transformations in Grade 8, with a clear path into the z axis and 3D design.
The printer that made the board then becomes part of the lesson. AOSEED kids 3D printers are built around guided apps and ready to print projects for homes and classrooms. For a Grade 5 to 8 room, the X-MAKER, currently $359 (regular $509), has the build space for a full board and enough headroom for students to design and test their own pegs.
FAQs
How can I teach students about the Cartesian plane?
Start with the origin and two number lines, then have students plot points by moving along x first and y second. Physical practice before worksheets helps the order stick. Grade 5 standards introduce the coordinate system as two perpendicular axes that meet at zero, with each point named by an ordered pair. Once students plot in the first quadrant without prompts, add negative values and the four quadrants. A printed board with pegs lets them test each prediction and fix it right away, which keeps mistakes cheap and conversation high. Partner roles such as caller, plotter, and checker make every student explain a route. Practical tip: have students say "x first, y second" out loud for the first five points they plot.
Can you provide some lesson plans for 3D printing?
Yes. The plan above is a complete 60 minute math lesson built around a printed coordinate board, and it scales from Grade 5 to Grade 8. Strong 3D printing lessons follow the same pattern: print a physical model, have students measure or handle it, then connect it back to the math. For a paper based companion, TeachEngineering's Coordinates and the Cartesian Plane lesson covers labeling the plane and plotting data for Grades 7 to 9. A second lesson can have students design their own pegs in Tinkercad, which turns measurement into a design problem with a real fit test. Practical tip: print shared manipulatives the day before so class time goes to thinking, not waiting on prints.
What are the learning objectives for learning about 3D shapes?
Students should be able to name common solids, describe them by faces, edges, and vertices, and build or model them from those attributes. Older students add volume, surface area, and position in space. Early grades usually focus on recognizing cubes, cylinders, cones, spheres, prisms, and pyramids and sorting them by attributes. By the middle grades, objectives shift toward measurement and locating points with ordered triples (x, y, z). A 3D printer ties both levels together because students must define length, width, and height as numbers before a shape can exist at all. Practical tip: ask students to design a simple prism in a free CAD tool and state its three dimensions before it goes to the printer.
What is a 3D Cartesian plane called?
It is usually called a three dimensional Cartesian coordinate system, or 3D coordinate space. Strictly speaking, a plane is flat, so the 3D version is a space rather than a plane. It adds a z axis at right angles to both x and y. Points are written as ordered triples such as (3, 2, 5), and the origin becomes (0, 0, 0). The three axes split space into eight regions called octants, compared with the four quadrants of a flat plane. Only the first octant, where every value is positive, has a number that all textbooks share. Practical tip: hold a peg above a plotted point on the board to show students why a third number is needed to describe height.
Can you explain the Cartesian plane in simple words?
It is a grid that gives every point an address made of two numbers. The first number says how far to go left or right, and the second says how far to go up or down. Two number lines cross at the origin, (0, 0). The horizontal one is the x axis and the vertical one is the y axis. Positive numbers go right or up; negative numbers go left or down. So (4, −2) means four steps right and two steps down from the origin. Swap the order to (−2, 4) and the point lands somewhere completely different. Practical tip: start with a treasure map game where the class must find a hidden object using only coordinates.
What is the difference between Cartesian and Euclidean?
Euclidean geometry is the geometry of flat space built from points, lines, angles, and proofs. Cartesian coordinates are a tool for describing that same space with numbers. Euclid's approach works with shapes and logical steps and never needs a grid. Descartes added a numerical frame so a point could be written as (x, y) and a line as an equation. The distance formula shows the link: it is the Pythagorean theorem from Euclidean geometry, written in Cartesian coordinates. In class, Euclidean thinking asks why a triangle is isosceles, while Cartesian thinking asks for the coordinates of its corners. Practical tip: plot a right triangle on the board and have students find the long side by the Pythagorean theorem.
Why is it called Cartesian?
The name comes from René Descartes, the French philosopher and mathematician whose Latin name was Renatus Cartesius. His 1637 work La Géométrie applied algebra to geometry. The MacTutor biography of René Descartes notes that La Géométrie appeared as an appendix to his Discourse on Method and that Cartesian geometry grew from it. Linking equations to shapes let mathematicians solve geometry problems with algebra, and the reverse. The tidy four quadrant grid printed in today's textbooks was refined by later mathematicians, but the core idea is his. Practical tip: use the story as a one minute hook, then ask students how they would describe an exact point if no grid existed.
What is a reflection on a Cartesian plane?
A reflection flips a point or shape across a line so the new position sits the same distance from that line on the other side. On a coordinate plane, the x axis and y axis are the usual mirror lines. Reflecting (3, 2) across the y axis gives (−3, 2): x changes sign and y stays the same. Reflecting it across the x axis gives (3, −2), and across both axes gives (−3, −2). Grade 6 standards expect students to notice that pairs differing only in sign are reflections, and Grade 8 standards ask them to describe reflections of whole shapes with coordinates. Practical tip: leave the original peg in place and add the reflected peg so students can compare both at once.



Further reading
3D Printed Cartesian Plane Lesson Plan: Math and Technology Integration for Grades 5 to 8

STEM Education for Kids: What It Means and How Parents Can Support It at Home

Small Gifts for Kids: Party Favors and Little Presents Kids Can Make